Introducing xCTRL: A Probabilistic Approach to Pitch Location Accuracy
Authors:
Matt Ludwig
Ryan S. Brill, Ph.D., Wharton Sports Analytics and Business Initiative Research Team
Abraham J. Wyner, Faculty Co-Director, Wharton Sports Analytics and Business Initiative
Published: June 10, 2025
Traditional baseball metrics such as WHIP (walks plus hits per inning pitched) and BB/9 (walks per nine innings) have long served as proxies for pitcher control. While accessible and concise, these measures are fundamentally limited: they disregard situational context and strategic intent. These statistics penalize all walks equally—regardless of whether the walk reflects a loss of command or a deliberate decision to avoid a dangerous hitter. In doing so, they conflate disparate pitching strategies and fail to assess individual differences. Crucially, they omit the intended pitch location, rendering them unable to measure true control.
More recent approaches, such as Location+¹ and Command+², acknowledge these limitations and attempt to incorporate pitch location data into evaluations of control. By measuring the exact location where each pitch crosses the strike zone, these methods include every pitch—irrespective of outcome—in the analysis. This eliminates many confounding factors inherent in outcome-based statistics, but it introduces a new problem: Location+ presumes fixed optimal target locations for each pitch type and count, across all pitchers. This uniformity fails to account for individualized strategies. Command+ accounts for individual pitcher tendencies but is still limited by assuming there exists a set number of fixed locations a pitcher can aim at. Under either of these measures, a pitcher with exceptional control who consistently targets zones that are atypical will be unjustly penalized. In essence, Location+ and Command+ impose a league-average framework on a skill that is inherently individual.
A better measure of control should operate at the pitch level and also be individualized to each pitcher. Ideally, it would quantify the distance between a pitch’s intended target and its actual location. Although there have been (failed) attempts to “observe” the target using the catcher’s glove position (i.e command/x), the true intended target is still fundamentally unobservable. Our innovation is to estimate the target statistically using a probabilistic framework based on every pitcher’s prior pitch locations and contextual variables. For example in Figure 1, the location density plots show that Gerrit Cole targets four distinct zones with his fastball against right-handed hitters, while Zack Wheeler targets only two. This heterogeneity in strategy is captured by modeling pitch locations as Gaussian mixtures with dynamic components fitted using cross-validation. We then use Expectation-Maximization (EM) algorithm to find posterior probability that a pitcher is targeting specific locations.
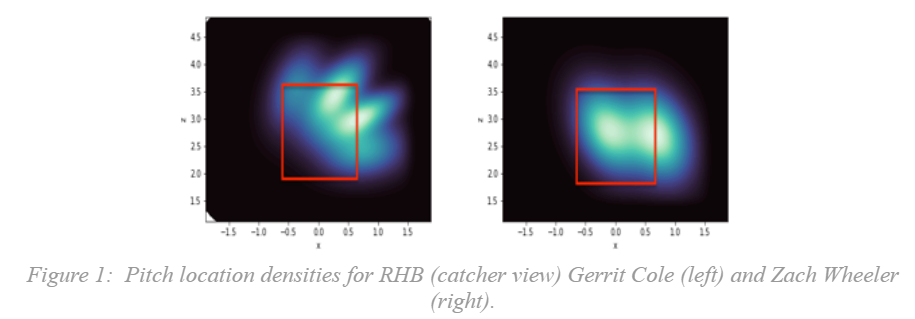
Once the target distributions have been parameterized, we compute a control measure, xCTRL, for each pitch as probability-weighted euclidean distance between the pitch’s actual location and each of the possible targets. This is achieved through the following process:
- For a given pitch, compute the posterior probability that each component of the Gaussian mixture model is the intended target.
- Measure the Euclidean distance between the actual pitch location and the mean of each target component.
- Weight each distance by its corresponding posterior probability
- Sum the probability-weighted distances to derive xCTRL for the pitch (in inches)
- Average the control scores across all pitches of the same type for a given pitcher to obtain the pitch-type-level control metric xCTRL for the season.
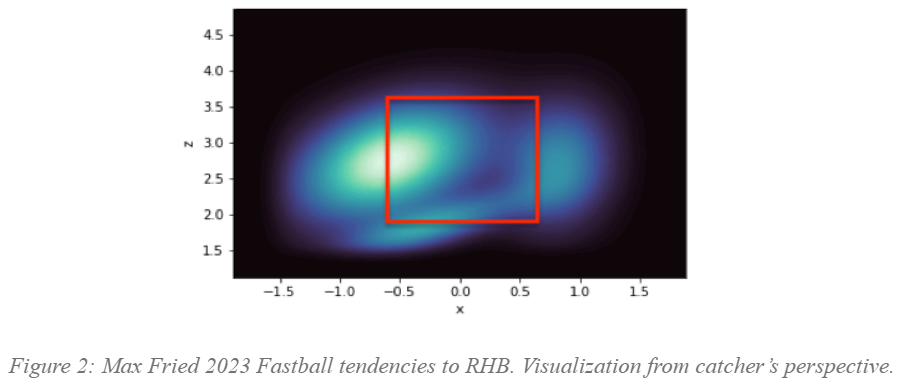
As an illustration, consider Max Fried’s fastball against right-handed batters. Based on historical data, our model identifies (Figure 2) three primary target zones: middle and hard inside, low and inside, and middle and away. These zones vary in frequency, with middle-in being by far the most prevalent.
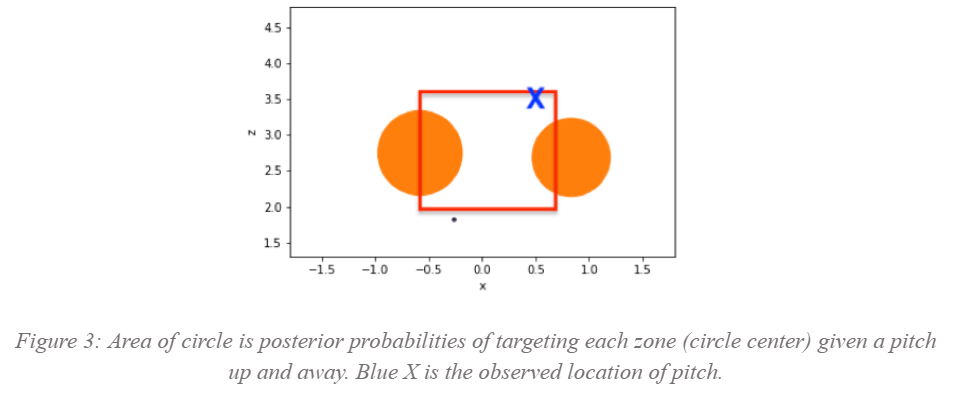
If Fried throws a pitch that lands high and away (in the strike zone) —a location unaligned with any of the historical target clusters—the posterior distribution collapses primarily to the middle-in and middle-away zones. This occurs because the actual pitch location (indicated by the blue mark in Figure 3) isn’t close to any of the 3 historical targets. The posterior probabilities for each of the targets (calculated using the EM algorithm) are [0.46, 0.54, 0.00] respectively. The distance from the blue mark to the centers of his targets are respectively [10.54, 15.80, 22.18] inches, which are quite large. Taking the dot-product, this pitch would get an xCTRL value of 13.38 inches, which isn’t great, even though the pitch is in the strike zone and may even be a tough pitch to hit. So despite the pitch being a good pitch within the strike zone, it’s a significant deviation from his expected targets which yields a large value of xCTRL , indicating poor control in expectation under our model.
Conversely, consider a pitch that lands low and away (the blue X in Figure 4). This location is consistent with Fried’s typical fastball behavior so the model assigns a high posterior probability to the middle-away cluster, resulting in a smaller distance between the pitch and the likely target suggesting accurate execution and a low xCTRL value.
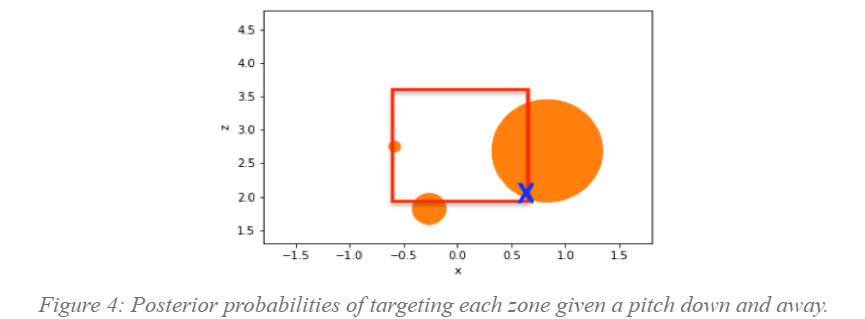
Here are the steps. Again using the EM algorithm, we calculate the posterior probabilities for each of Fried’s 3 historical targets to be [0.90, 0.01, 0.09]. Since the pitch is in line with Fried’s tendency to throw his fastball middle-away to right-handed batters we estimate that his true target is middle-away with 90% probability; low and inside with probability of 9%; and middle-inside with probability 1%. The distance from the pitch to the three targets is [8.40, 17.82, 11.33] inches. The distance to the highly probable target is small. The aggregate measure xCTRL is the dot-product of the distance vector and the probability vector which is 8.76 inches. Even though this pitch wasn’t exactly middle away or low and inside, it was relatively consistent with an established tendency. In other words, this pitch is on target because it was executed in-line with one of Fried’s typical fastball locations to right-handed batters.
We can do this for every pitch and every pitcher, averaging individual pitch level distances over an entire season grouped by pitch type. This allows us to rank pitchers fairly, without penalizing them for having location strategies that differ substantially from league wide averages. This is important given the disparity in fastball location tendencies among 4 of the most consistently dominant starters in baseball – Zack Wheeler, Gerrit Cole, Max Scherzer, and Max Fried³:

As we can see in Figure 5, these pitchers clearly locate their fastballs differently. Our approach, which judges control relative to their individual tendencies, is much more effective, accurate and consequently more useful.
We preliminarily validate the quality xCTRL by creating a ranking and analyzing the predictive ability of our metric on pitcher success. We create a ranking of fastball xCTRL because that is considered the pitch type whose success is most impacted by control. Since pitch quality is also relevant for success, we include a pitcher’s fastball Stuff+ as well. We collect 118 pitcher-seasons with qualified xCTRL, Stuff+and Location+ from 2021 through the 2023 MLB season (for simplicity and uniformity, we only include starters in our analysis.)
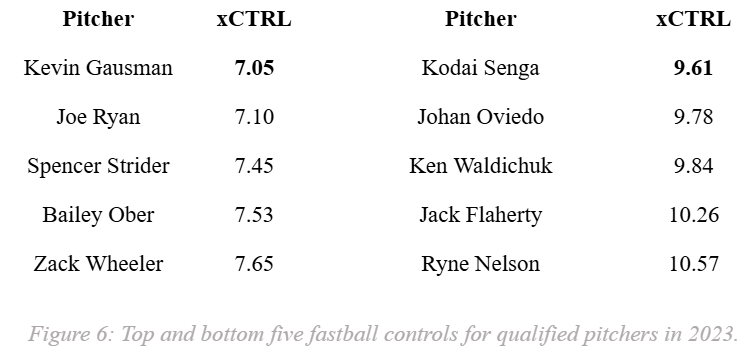
The rankings of xCTRL in Figure 6 is a sanity check on our metric, as it generally falls in line with fan expectations. An xCTRL value of 7.05 inches is astounding. A baseball is slightly less than 3 inches in diameter. That means the best control pitchers are only missing their intended location within a radius of slightly more than 2 baseballs on average. Even the worst control pitchers on our list are missing by only slightly more than 3 baseballs on average.
Next, we run a multiple regression analysis to see how predictive control is for pitcher success, when accounting for Stuff+. Since ERA is considered a relatively unstable measure, we use Fielding Independent Pitching (FIP) as our dependent variable.

We see that both control and Stuff+ are significant variables, xCTRL has a positive coefficient because a larger value indicates worse performance, similar to FIP. The variable Stuff+ has a negative coefficient since at any given level of control, better stuff leads to lower FIP. Our model estimates that, on average, an improvement of a fastball xCTRL by1 inch leads to roughly 0.3 points better FIP, holding Stuff+ constant. Since FIP is on the same scale as ERA, a 0.30 FIP runs saved is a (practically) significant increase. Pitchers with the best control are expected to be about one run better in FIP compared to the worst fastball control pitchers, who have the same stuff. That’s roughly an entire run saved per game directly because of fastball control alone.
Pitchers with excellent pitch quality but poor control are commonly considered more variable game-to-game and less reliable as starters. If that’s the case, we ask: does control predict more consistent results throughout the season? To answer that we run a multiple regression for Inning Pitched (a proxy for reliability) using Stuff+ and xCTRL as independent variables.

Our model (Figure 8) shows that fastball xCTRL is a highly significant indicator of Innings Pitched and Stuff+ isn’t significant at all. Better control isn’t just relevant for rate-normalized value statistics like FIP, it’s a significant factor in predicting cumulative pitcher value throughout a season. The best fastball control pitchers are expected to pitch roughly 36 more innings in a season than the worst fastball control pitchers. Interestingly, Loc+ is not correlated with IP.
Finally, we were interested in understanding the season-over-season stability of xCTRL. Within the dataset we’ve been using, there were 53 data points for a pitcher’s fastball control across multiple seasons. Between successive seasons, a pitcher’s xCTRL has a correlation value of 0.65. The interseason correlation for Stuff+ is slightly stronger at 0.73. Both xCTRL and Stuff+ have much higher interseason correlation than ERA which has an inter-season correlation of 0.19. FIP also has a high inter-season correlation of .48 but Loc+ is only .37 which is much lower than the inter-season correlation for xCTRL. This gives us great confidence that what we are measuring is a reliable measure of pitcher skill.
Overall the results are conclusive: our new control statistic xCTRL is a stable metric which holds significant predictive value for pitcher success and usage. By taking a more mathematically challenging—yet more sensible and intuitive—approach to control, measuring location relative to a pitcher’s tendencies, we’ve substantially improved upon existing control metrics.
Notes
- Starting pitchers were chosen for this article because they had the lowest cumulative ERA over the past several seasons. Corbin Burnes and Framber Valdez weren’t included due to insufficient number of four-seam fastballs.
- Stuff+ data became available starting in the 2020 MLB season, limiting data for multiple regression analysis.
- Stuff+ isn’t reported at the pitch or game level, restricting the granularity of analysis we can perform
- Control’s impact on Innings Pitched is likely understated in our regression. Our dataset only includes starting pitchers who threw more than 1000 fastballs in a season, therefore eliminating pitchers who suffered significant in-season injuries. Stuff+ is positively correlated with injury risk (MLB Injury Risk Study), meaning we don’t account for the additional innings that a high-Control, low-Stuff+ pitcher accumulates due to less frequent injuries.
References
- ¹Location+ Primer: https://library.fangraphs.com/pitching/stuff-location-and-pitching-primer/
- ²Command+ and Commandf/x: https://www.nytimes.com/athletic/346863/2018/05/10/exclusive-a-big-step-forward-in-measuring-command/
- ³Best starter ERA: https://x.com/SlangsOnSports/status/1866622872682193222
- Stuff+ primer: https://library.fangraphs.com/pitching/stuff-location-and-pitching-primer/


