Beyond Expected Goals: A Possession-Aware View of Chance Creation in Soccer
Authors:
Jonathan Pipping, Ph.D. Student, Wharton Sports Analytics and Business Initiative Research Team
Tianshu Feng, MSE Data Science, University of Pennsylvania ’26
Paul Sabin, Senior Sports Analytics Fellow, Wharton Sports Analytics and Business Initiative
Published: November 13, 2025
Limitations of Expected Goals (xG)
Expected goals (xG) tells us how likely a recorded shot is to become a goal. It’s a useful statistic, but it skips the step that often matters most: creating the shot. Crosses that are a toe away, cutbacks that are nicked at the last instant, or a striker who creates space and then takes a half-second too long to shoot – standard xG gives those near-shots a value of zero because no shot occurred. It can also over-count during rebound scrambles where only one goal could ever be scored. These blind spots are significant and ripple into team ratings
and player evaluation that lean on xG as a measuring stick.
Motivating Example
The sequence below highlights this difference clearly. Here, Kylian Mbappé first has a guarded look, then shakes his marker and turns it into a clean shot. Traditional xG gives a big number (0.5 per FBRef) to the final shot, but completely neglects the most skillful part: creating it.
Our framework credits both the chance of a shot happening and the chance it goes in once it does, so the value rises as the opportunity is created, not just when the trigger is finally pulled.


Figure 1: This move showcases the value of shot creation, not just conversion. Our metric credits both steps, not just the final shot.
Introducing xG+
We split the problem into two bite-sized probabilities at each instant t. Let xSt represent the probability that a shot occurs in the next second and xGt represent the probability that a shot is scored given that it’s taken at time 𝑡. Symbolically,

which respects that a maximum of one goal can result from each possession. This effectively adds up danger over a possession without double-counting rebounds or omitting near-chances that never manifest as observed shots.
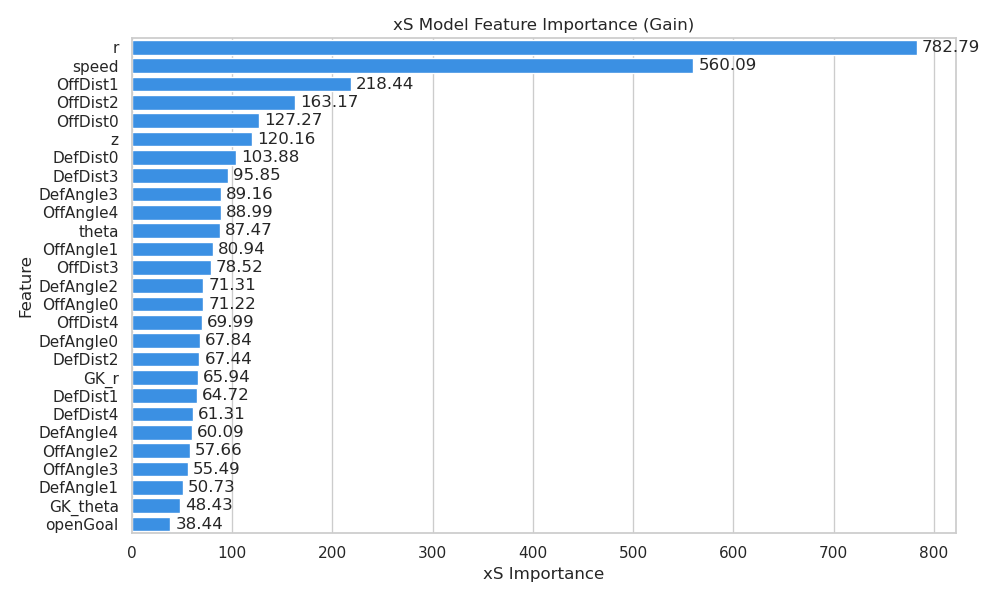
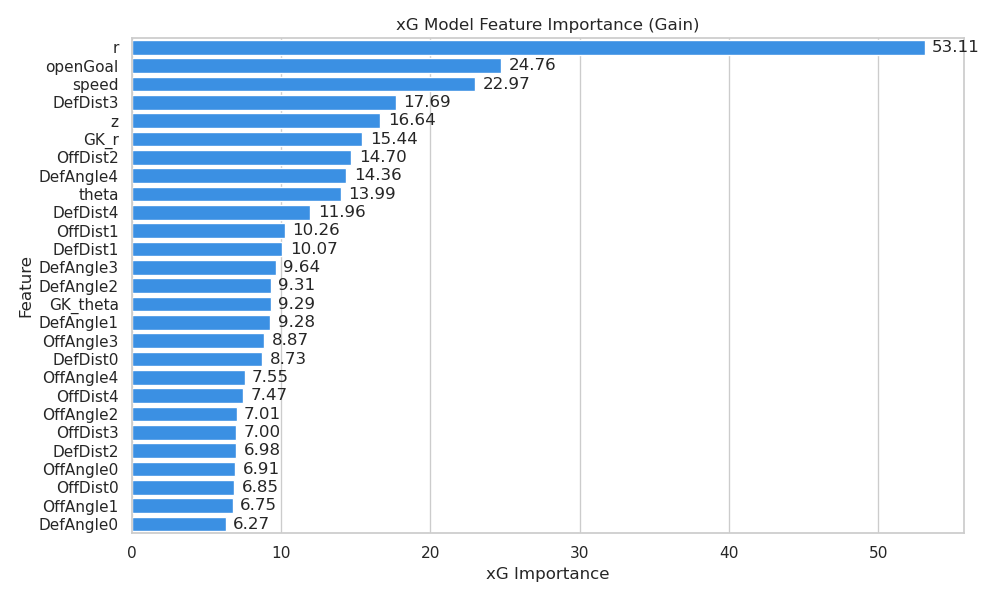
To estimate xS and xG, we train two gradient-boosted trees on tracking + event data (from Gradient Sports) for three EPL seasons (2022–25). Features cover the ball (distance, angle, height, speed), goalkeeper position, and compact summaries of nearby attackers and defenders (distances/bearings to the closest five). Distance dominates both tasks; an “open goal” proxy helps finishing probability while higher ball speed generally triggers shots (good for xS) but makes them a bit harder to convert (tougher for xG), which aligns with intuition about rushed chances.


Does this help predict games?
To answer that on the team level, we do a cross-validation study where each fold is a matchday. Within each fold we translate each metric (xG, xS, xG+) into season/team/opponent effects with a simple mixed-effects Poisson, then predict goals out of sample.
Possession-aware xG+ reduces error versus standard xG (including naive sums) and xS alone. Practically, using either the possession “at-least-one” aggregator or a simple max-per-possession proxy beats independent shot summation because it matches how attacks actually unfold.

Does this predict future player performance?
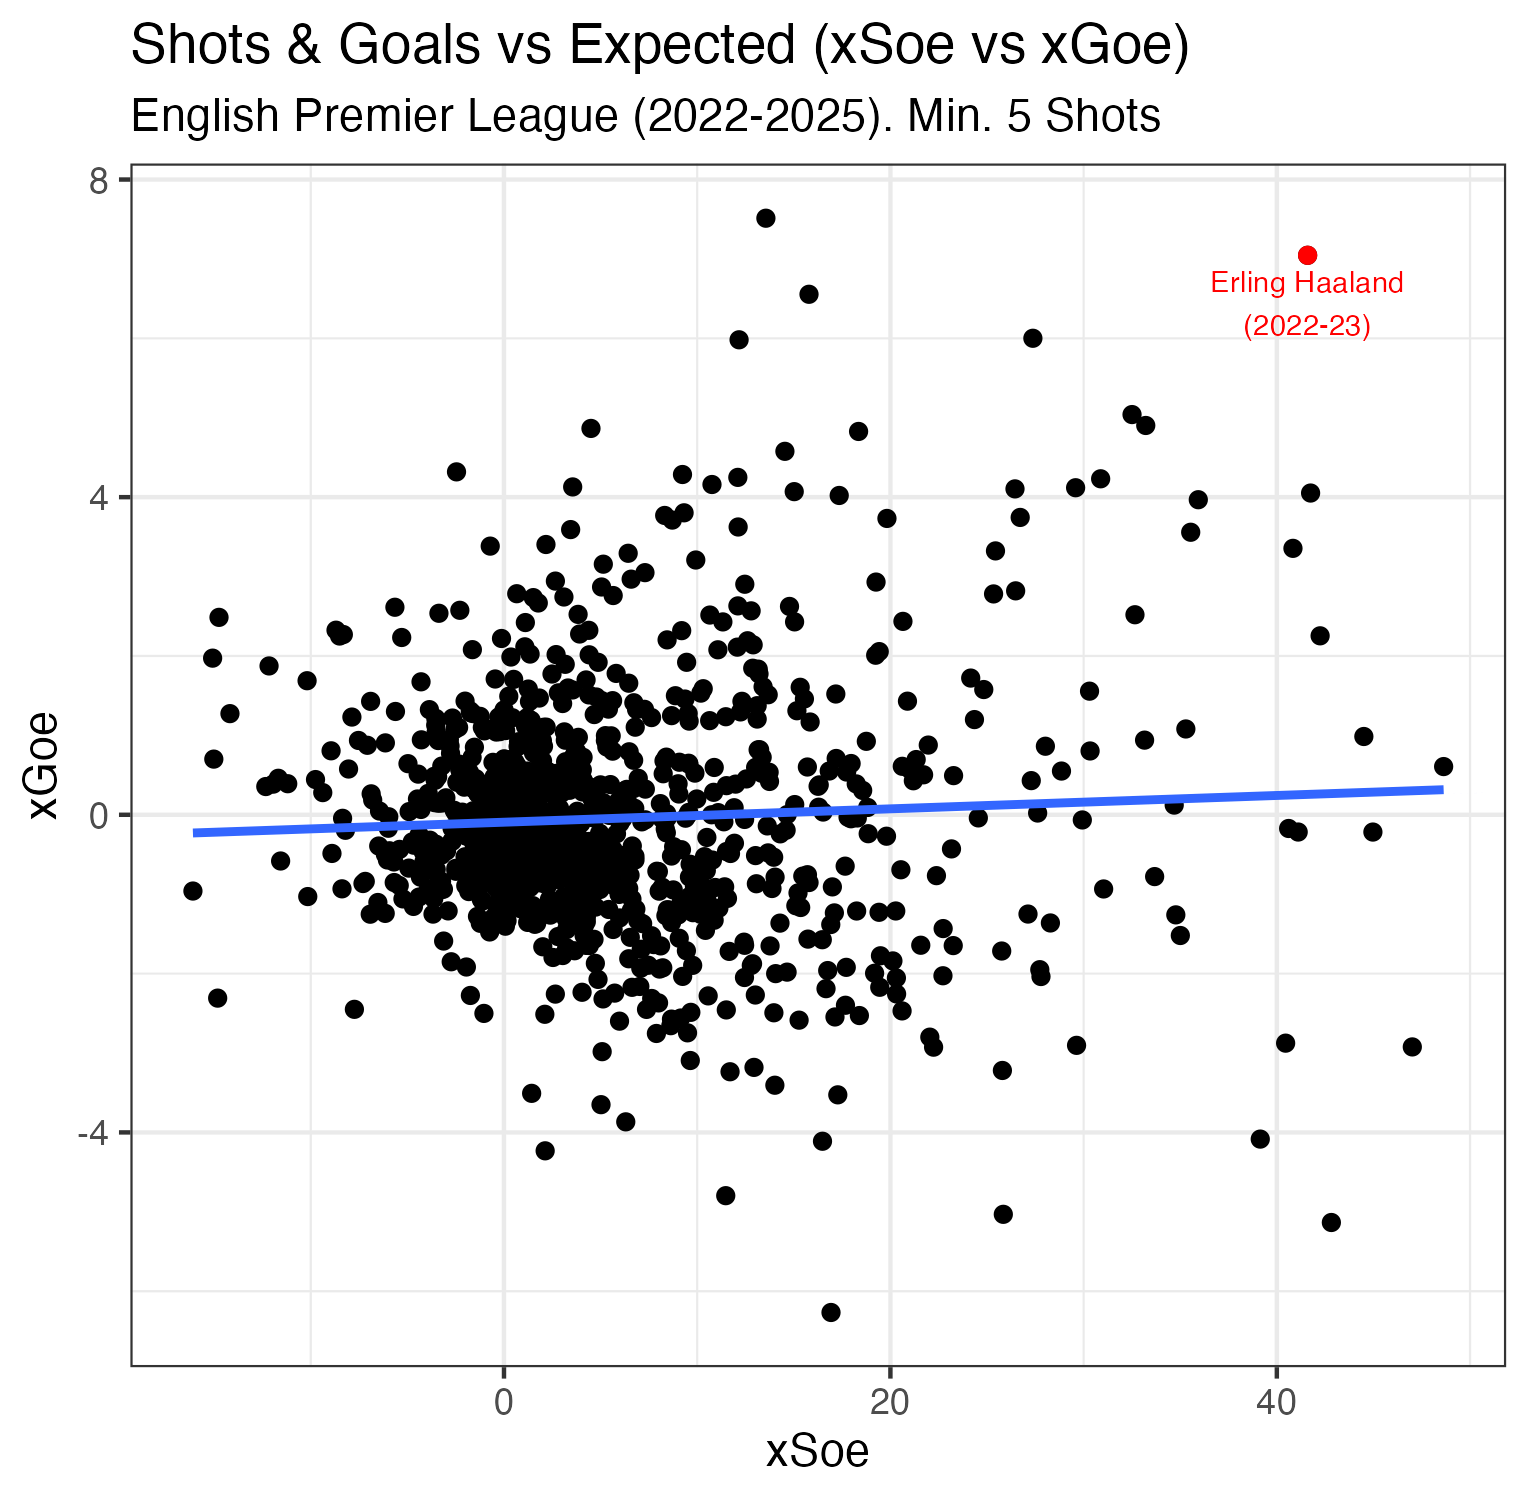
For players, the repeatable edge lives in shot creation. “Shots over expected” (how often a player gets a shot off relative to context) is much more stable year-to-year than goals over expected.
The scatter below compares both shots vs xS and goals vs xG for players in our dataset. Movement to the right (consistent creation) sticks; big vertical pops (finishing more than expected) come and go from one year to the next. By combining creation and conversion, xG+ captures both sides of attacking skill in one number.

The scatter below compares both shots vs xS and goals vs xG for players in our dataset. Movement to the right (consistent creation) sticks; big vertical pops (finishing more than expected) come and go from one year to the next. By combining creation and conversion, xG+ captures both sides of attacking skill in one number.
Discussion
Bottom line: what happens before the shot captures even more information about goalscoring than what happens after the shot. Furthermore, these estimates are more predictive of both team and individual performance, capturing value that players like Mbappé and Haaland consistently provide. Additionally, aggregating over possessions ensures that dangerous moments that never became shots are credited, while avoiding rebound inflation and maintaining a clean interpretation of goal expectancy over a game.
Limitations & Future Work
Some limits remain (such as tracking noise, a one-second xS window, exposure differences by team), but the pieces are modular and ready for extensions like sequence models for xS, hierarchical player/team effects, and defensive mirrors that value suppression as well as creation.


