Optimal Substitution Time
Authors:
Kaishu Mason, WG’25
Paul Sabin, Senior Sports Analytics Fellow, Wharton Sports Analytics and Business Initiative
Published: October 31, 2024
The Greatest Game
In the 2022 World Cup final against Argentina, France was down two goals as their hope of repeating as World Cup Champions appeared to be quickly fading. Despite most managers waiting until around 60 minutes into the match to make substitutions, French manager Didier Deschamps made the controversial decision to substitute Olivier Giroud and Ousmane Dembélé just 40 minutes into the match.
The decision appeared initially to be a good one as France roared back to tie the game to send it into extra time before giving up the lead again, and tying it again, before losing in penalty kicks.
The initial move to substitute so early made some wonder if Deschamps was giving up too prematurely on seasoned veterans such as Giroud, who is France’s all-time top goal scorer.
Was the comeback due to luck or did the substitutions significantly increased the chances of a comeback? Or, more simply put, at what point should a manager substitute a better player who is fatigued for someone with fresh legs given the current state of the match?
This was the question we answer that, to our knowledge, has not previously been answered through a statistical lens. We model the effect of fatigue, among other variables, on the rate of scoring and use simulation to show that a substitution for better offense is the optimal move, even in the first half, when a team is trailing.

Effect of Player Skill, Fatigue,and Home Field Advantage
The first step is defining the likelihood of scoring based on the players on the field, accounting for the impact of fatigue. We use data from the English Premier League (EPL) between 2016 and 2021 to fit this model.
Following common practice, we use the Expected Goals (xG) scored in a time frame as opposed to actual goals. There are some nice theoretical properties of using xG, such that it is an unbiased estimate of goals scored, and the variance is smaller than if we used goals.
We found that a team’s expected goals per 90 minutes is influenced primarily by six factors:
- Home Field Advantage
- Extra Time
- Half
- Offensive Player’s Skill
- Defensive Player’s Skill
- Fatigue
Our linear model to fit a team’s expected goals per 90 minutes is
Xg/90 = βteam offense + βopponent defense + βhalf + βextra time + βHome/Away + βfatigue .
To quantify player abilities, we used their FIFA video game ratings for offensive and defensive positions. A team’s total offensive and defensive ratings were calculated as the sum of the individual player ratings. Fatigue was computed based on the difference in average minutes played for the players on the pitch between the two teams.
Our analysis shows that home field advantage is worth 0.23 goals per 90 minutes. Scoring rates increase by about 0.175 goals per 90 minutes in the second half and during extra time. Additionally, an increase of 100 points in offensive rating (sum of the player ratings) corresponds to an increase of 0.76 goals per 90 minutes, while the same increase in defensive rating reduces goals by 0.58 per 90 minutes. Fatigue, calculated as one half’s worth of play time, results in an expected reduction of 2.5 offensive and 3.5 defensive FIFA points.
Goal Scoring is Not Uniform Across Time
Now that we know a team’s xG/90, we explore how these goals are distributed. Are goals scored at random times throughout the game or does the probability of a goal being scored increase/decrease over time?
Initially we look at the timings of the first goal across all games. This is because there are very few substitutions in the first half and thus if goals were scored at a constant rate, then the first goal should follow a certain known shape, i.e an exponential.
As seen in Figure 2, it turns out that timings of first goals is not exponential but more similar to that of a Weibull process where the rate of goals increases over time. We can see that in the following plots the observed Kaplan-Meier curve more closely aligns with the Weibull than the Exponential rates. This backs up the conventional wisdom that players tend to feel things out in the first few minutes before turning up the aggression.
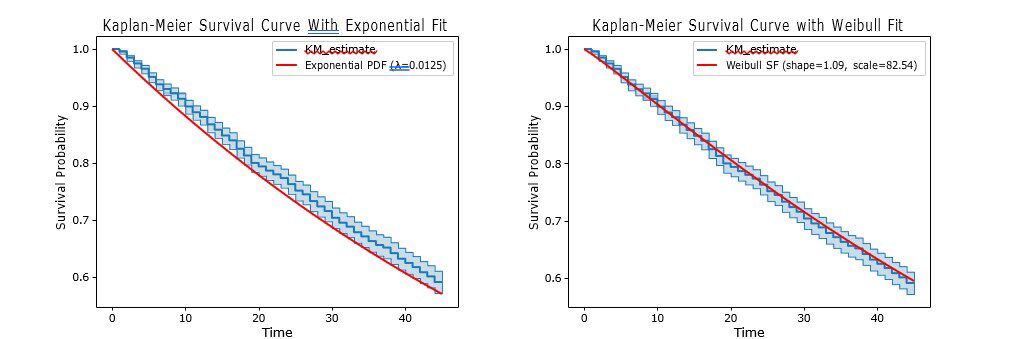
Figure 2: Kaplan-Meier Plot with Exponential Fit vs Kaplan-Meier Plot with Weibull Fit
Evaluating Optimal Substitution Timings
During the game, a coach’s primary influence is by way of substitution. The decision of when to substitute (and who) is a highly dynamic process that depends on the game state; in particular the score differential, time remaining in the game, and the exact player(s) being substituted. We aim to answer the question, “If the substitute is K FIFA points worse on offense/defense, what is the minimum time t such that making the substitution at time t would improve a team’s win probability?”
Simulating Soccer Games
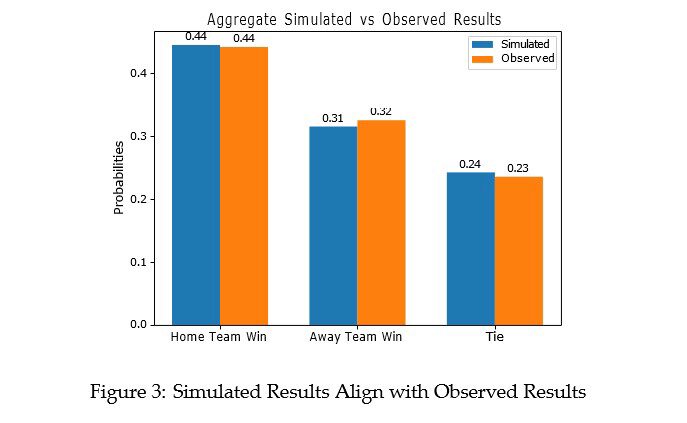
In order to do this we simulate the goal scoring rates using our model while incorporating the negative correlation (via a copula) between competing teams. The calibration of our simulations can be seen in Figure 3.
These game simulations allow us to evaluate the team’s current probability of winning and contrast scenarios with no substitutions to ones where the manager made the substitution. We perform these substitutions under 3 scenarios; being down 1, tied, or up 1.
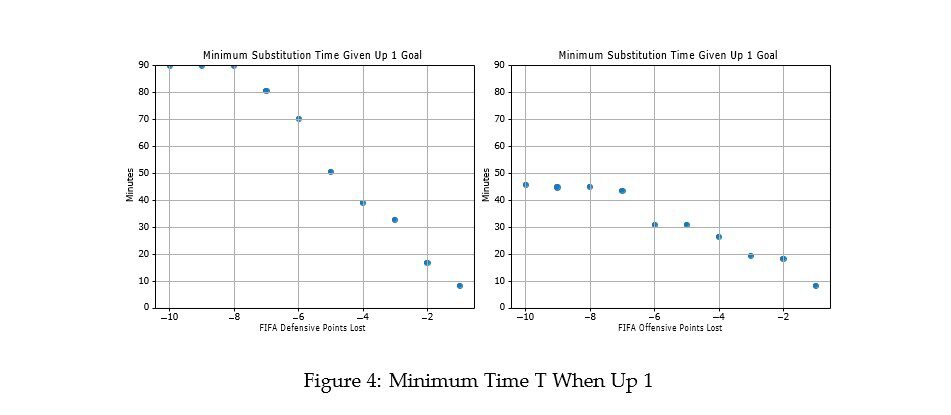
Winning According to Figure 4, we see that when a team is leading by one goal, a “park the bus” strategy is most effective. Once a team takes the lead, it becomes immediately advantageous to substitute in defensive players to minimize the opponent’s chances of scoring.This is evident as it becomes acceptable to substitute a player who loses 10 offensive points just 47 minutes into the game, whereas it is never advisable to substitute a player who loses 10 defensive points.
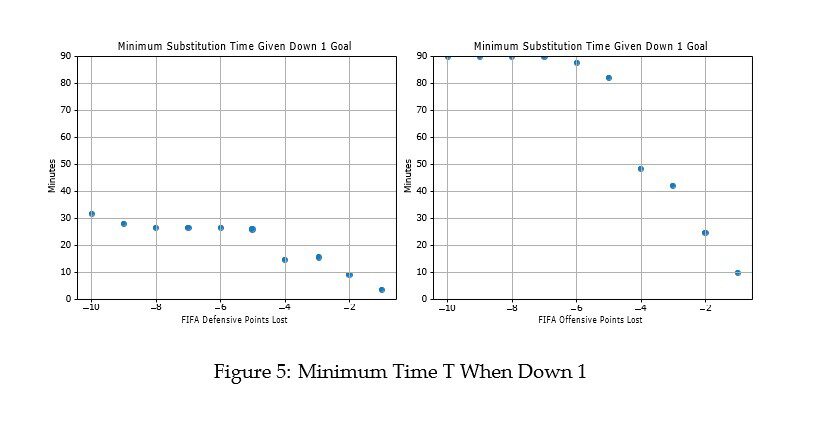
Losing As seen in Figure 5, When a team is trailing by one goal, the opposite is true: losing 10 defensive points is justifiable after only 32 minutes, whereas substituting a player who loses 10 offensive points is never advisable.
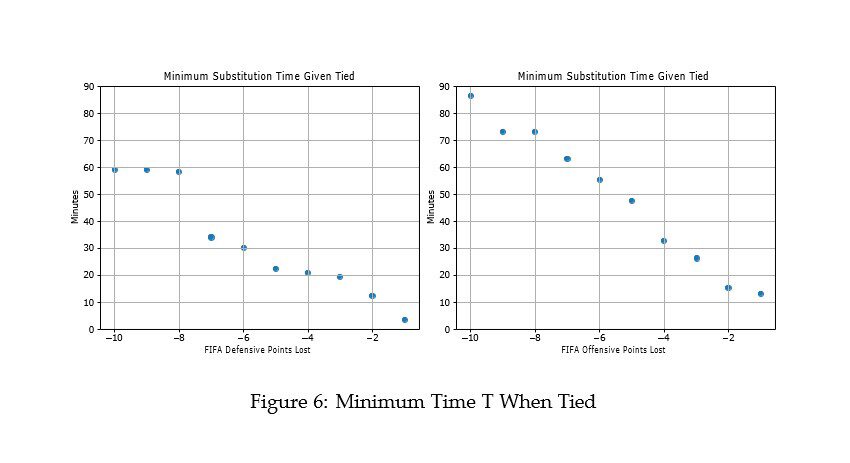
Tie When the game is tied, there is no clear consensus on which statistic is more valuable as seen in Figure 6, as both offensive and defensive FIFA stats have significant impacts depending on the situation. In this case, the minimum time aligns closely with a heuristic indicating that when tied, a team should primarily focus on maximizing the difference in long run goals scored between the two teams.
These simulations shed light into optimal substitution strategies when both teams are equally skilled but these times may differ based on the opponent’s offensive output. Because we are able to simulate game outcomes from any game state, to investigate these scenarios we tune the relevant parameters and simulate, allowing for the assessment of whether a substitution would be beneficial at any stage of the game.
Revisiting the 2022 World Cup Final
France’s comeback after the substitutions was impressive, but it’s possible the team could have rallied similarly without the changes. We used simulations to assess Deschamps’ decision and quantify how the substitutions affected France’s win probability. In each scenario we simulated the game 5000 times.
Without the substitutions, the likelihood of France winning was estimated at 3.2%, with an 8.44% chance of forcing a tie by the end of regulation. After the substitutions, the probability of winning increased slightly to 3.82%, and the chance of tying rose to 8.98%. Although France’s overall chances of winning only improved from 7.42% to 8.31%, the decision to make the substitutions was still optimal.
This becomes even clearer when considering additional factors: Giroud and Dembele had already logged significant minutes throughout the tournament and so the effect of fatigue could be even more pronounced. Combined with Deschamps’ belief that the changes would better counter Argentina’s pressure, something our model doesn’t account for, the decision to substitute that early is more than justified.
Ultimately, this decision was about making the best of a difficult situation, as France’s chances of winning were already slim. But in a game decided by the finest margins, every percentage point counts.


