Fourth Down Conversion Frequencies Are Higher Than You Think
Authors:
Ryan S. Brill, Ph.D. Candidate, Wharton Sports Analytics and Business Initiative Research Team
Abraham J. Wyner, Faculty Co-Director, Wharton Sports Analytics and Business Initiative
Published: September 20, 2024

During the Monday Night Football game on September 16, 2024,¹ the Falcons had a fourth-down and four at the very end of the second quarter on the road against the Eagles. Seth Walder said ESPN’s model leans towards going for it. Our model² was inconclusive: we also leaned go-for-it but with little confidence. Specifically, in the second figure below, our 90% confidence interval (CI) for the gain in win probability by going for it rather than attempting a field goal (the blue column, denoted 90% WP gain CI) is [-5%, 8%], which is very wide. Going for it could plausibly be a good or bad decision. Further, just 67% of our bootstrapped win probability models (the orange column, denoted boot%) estimate going for it to be better than attempting a field goal.
The Falcons successfully kicked a field goal, a reasonable decision. Our model suggests a baseline coach almost always attempts a field goal in this situation.


On September 8, 2024,³ the Bengals had a fourth down and five at the end of the game at home against the Patriots. They punted; our model could not have disagreed more strongly.

We were a bit puzzled that fourth-down conversion attempt success probability was estimated to be 0.47 with 4 yards to go to and 0.44 with 5 yards to go. This felt a bit high. If you were to ask us yesterday to give a subjective estimate of the conversion probability with 5 yards to go, we would have guessed closer to a third.
Is it just us? Eric Bradlow also guessed much lower as did an NFL front-office worker. Ryan asked the other nine members of his fantasy football league: they guessed {0.15, 0.20, 0.25, 0.30, 0.37, 0.40, 0.40, 0.45, 0.72}. The mean guess is 0.36, the median guess is 0.37, and the s.d. is 0.17. Removing the max and min, the mean is 0.34, the median is 0.33, and the s.d. is 0.09. So, the typical person in Ryan’s fantasy league agrees with our guess.
Is there something wrong with the model or is our intuition just bad? Let’s use our NFL play-by-play dataset of 600,825 plays from 2006 to 2021. Of these plays, there are 106,733 third-down plays and 8,258 fourth-down plays that are either pass or run plays (i.e., conversion attempts). In 2018-2021 alone, there are 25,937 third-down plays and 2,556 fourth-down plays.
As always, we start with base rates (i.e., observed frequencies) of conversions. Across all fourth and five plays, 42.7% were successfully converted. Across all third and five plays, 43.4% were successfully converted. Those numbers dip to 42.3% and 43.3% from 2018-2021, respectively. So, the base rates are closer to our model’s numbers and further from our guesses.
Where do our intuitions come from? The base rate across all plays with 5 yards to go is 40% and across all first and second-down plays with 5 yards to go is 39%, lower than the third and fourth-down base rates.
But, these numbers are frequencies arising from observational data. Just under 43% of fourth and five plays in our dataset were successfully converted. We need to think about issues like imbalanced data, selection bias, survival bias, and other reasons the past frequency may not be readily turned into a probability.
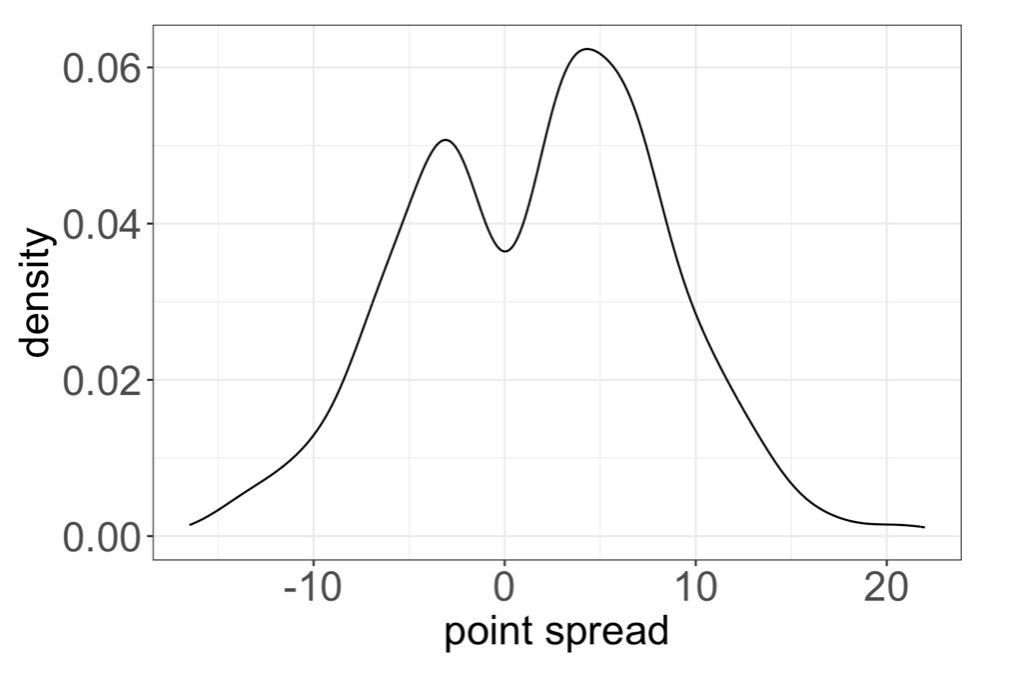
Indeed, the dataset is imbalanced with respect to team quality. Among all fourth and five plays, the density of pre-game point spread with respect to the team with possession skews left, with a mean of 1.70 (1.97 for plays from 2018-2021). The bad teams have more observed fourth-down conversion attempts. This may be because teams go for it when they are behind towards the end of games, and more bad teams find themselves in fourth and long situations. By adjusting for team quality, we should find that estimated fourth-down conversion success probability for an average team is higher than the base rate.

Another concern is survival bias. A team who fails a fourth-down conversion attempt has no more remaining attempts in that drive. To account for this, we use just the first fourth- down play in each drive. This results in a dataset of 7,688 fourth-down conversion attempts. We then fit a logistic regression model which adjusts for team quality using the point spread:4
P(success) = logistic[β0 + β1 ⋅ pointspread + γ ⋅ spline(log(ydstogo+1))] .
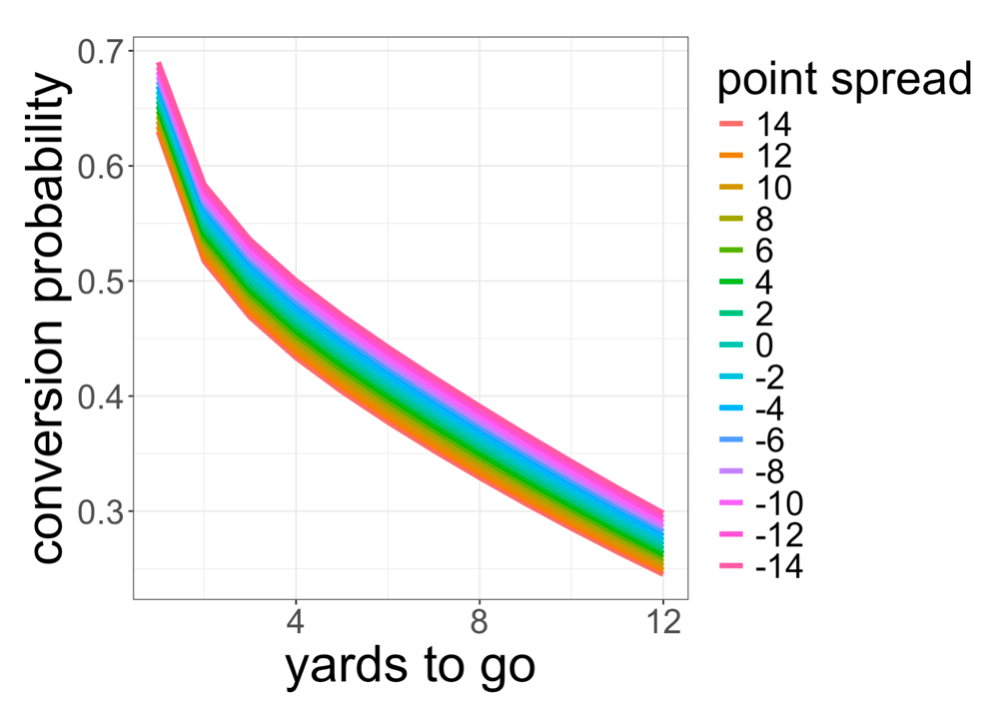
This model estimates the fourth and five conversion probability for evenly matched teams (even point spread) to be 43.7%, very similar to our model shown in the initial figure for the Bengals play and larger than the base rate. Predictions differ for unevenly matched teams (i.e., nonzero point spread). A decrease in the point spread by 7 is associated with an increase in estimated conversion success probability by about 2%. For example, the fourth and five success predictions associated with point spreads {14, 7, 0, -7, -14} are {0.40, 0.42, 0.437, 0.45, 0.47}.

Our conversion probability model, while far from complete, is good for prediction. Nonetheless, it still seems surprising! We should consider recalibrating our intuition for conversion probabilities, especially for the favored team. For a heavily favored offense, 4th and 4 can be a 50-50 proposition and 4th and 8 can be nearly a 40% proposition. For an evenly matched team, subtract a yard to get the same probability (e.g., 4th and 3 can be a 50-50 proposition for a heavily favored offense). Perhaps if coaches internalized that they would be more opportunistic.
__________
¹http://www.espn.com/nfl/playbyplay/_/gameId/401671691
²https://arxiv.org/abs/2311.03490


